Financial/Business Data-Performance Highlights (Consolidated)-

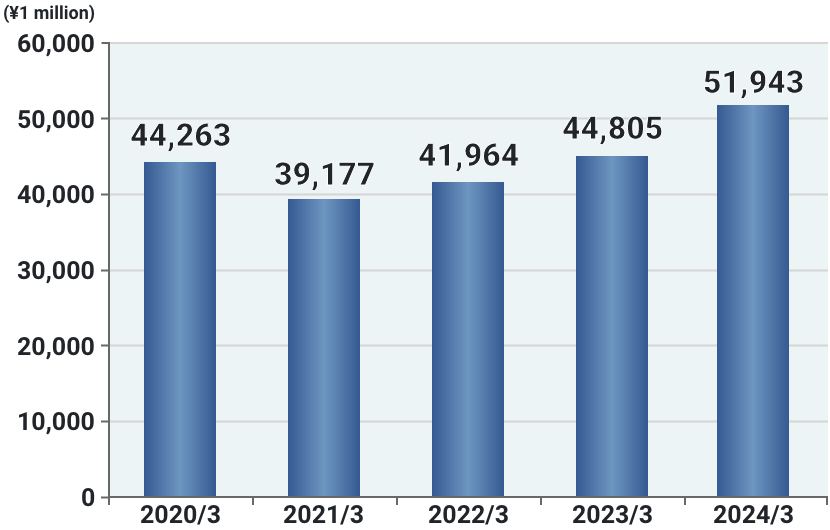
Net Sales
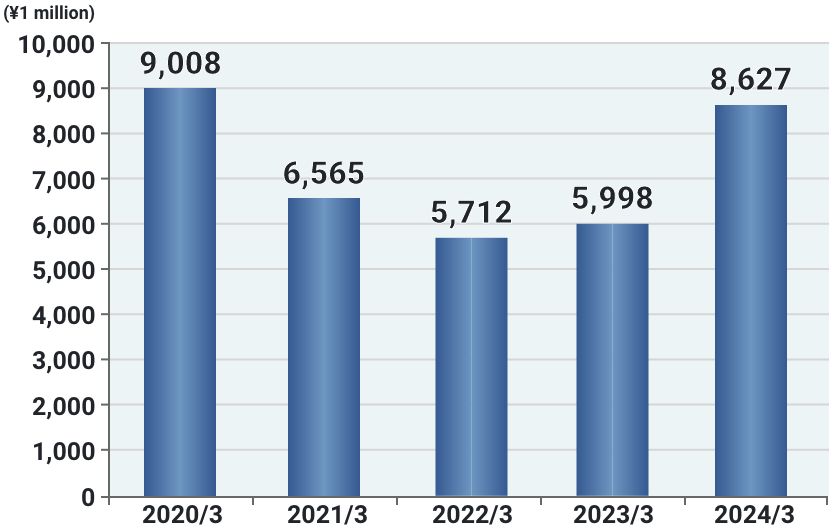
Operating Profit
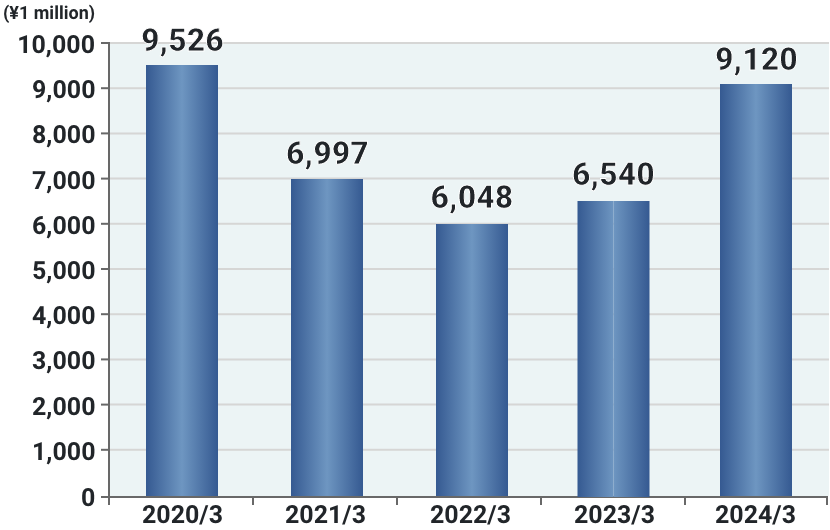
Ordinary Profit
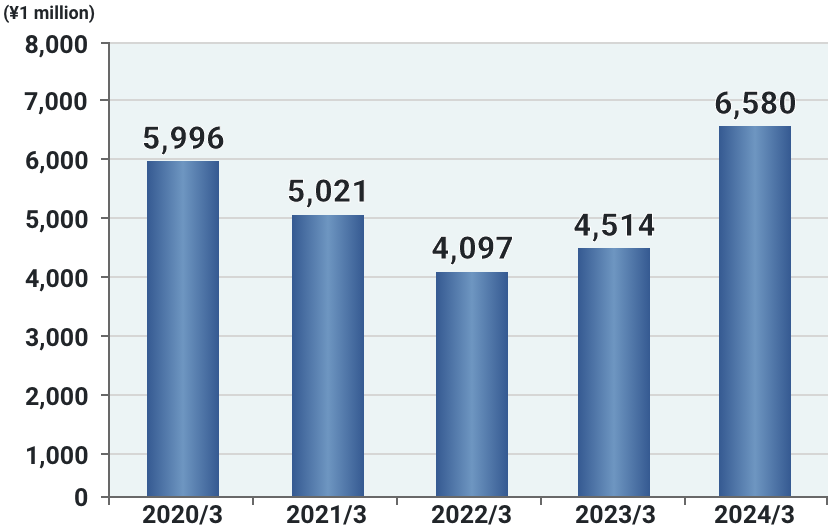
Profit Attributable to owners of parent
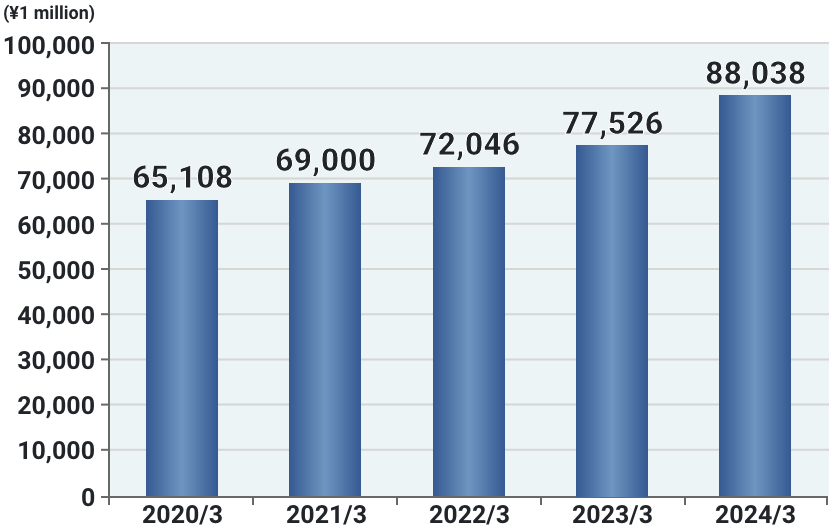
Total Assets
Net Assets
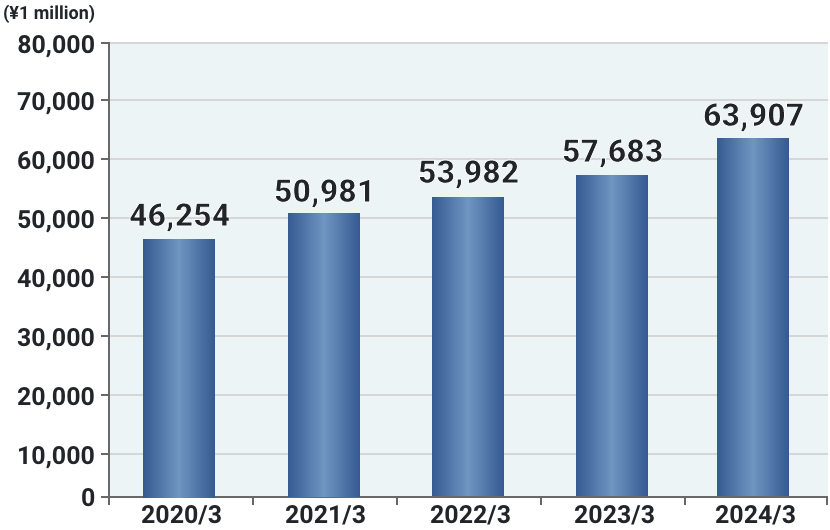
(Unit: ¥1 million)
| 2020/3 | 2021/3 | 2022/3 | 2023/3 | 2024/3 | |
|---|---|---|---|---|---|
| Net Sales | 44,263 | 39,177 | 41,964 | 44,805 | 51,943 |
| Operating Profit | 9,008 | 6,565 | 5,712 | 5,998 | 8,627 |
| Ordinary Profit | 9,526 | 6,997 | 6,048 | 6,540 | 9,120 |
| Profit Attributable to owners of parent | 5,996 | 5,021 | 4,097 | 4,514 | 6,580 |
| Total Assets | 65,108 | 69,000 | 72,046 | 77,526 | 88,038 |
| Net Assets | 46,254 | 50,981 | 53,982 | 57,683 | 63,907 |
※There will be a time lag from the date of information disclosure to the date of updating the pertinent page.
For the latest qualitative/quantitative information, please refer to the financial results and the like in the IR Information section.