Financial/Business Data-Main Financial Indicators (Consolidated)-

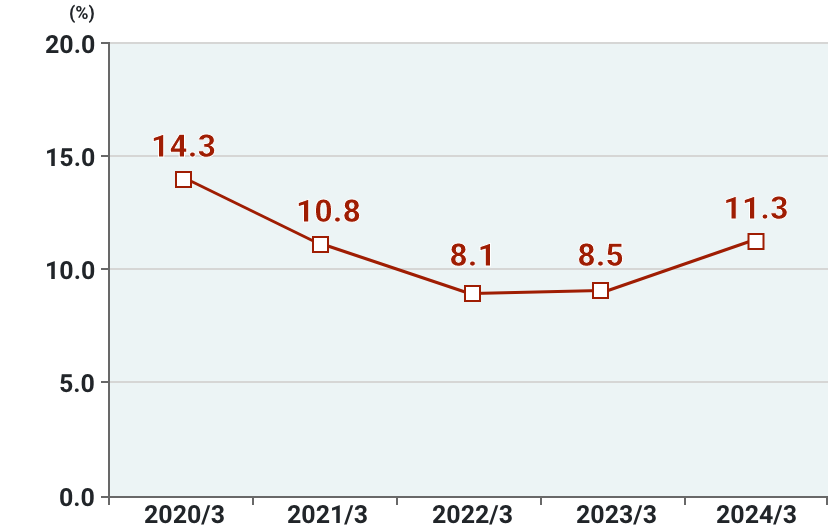
Return on Equity [ROE]
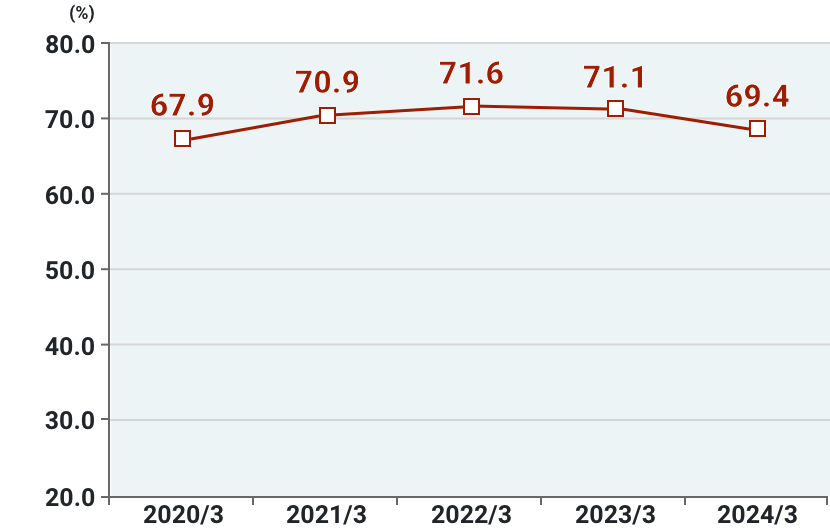
Capital Adequacy Ratio
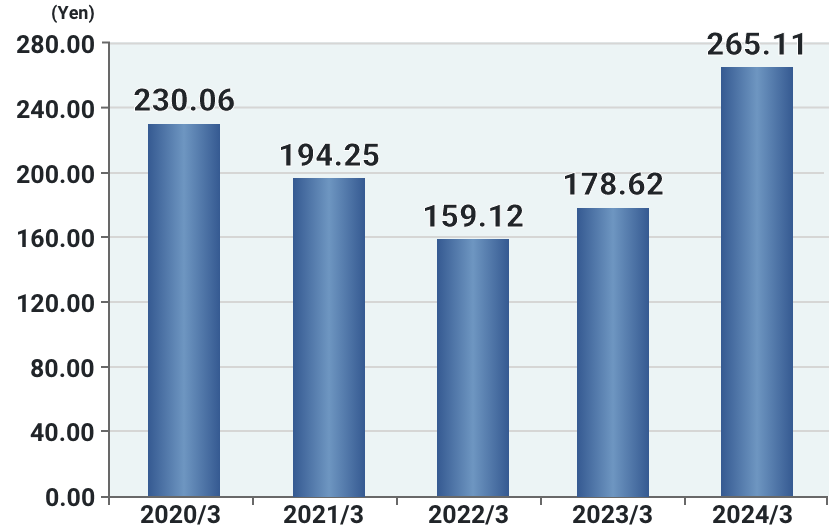
Earnings per Share [EPS]
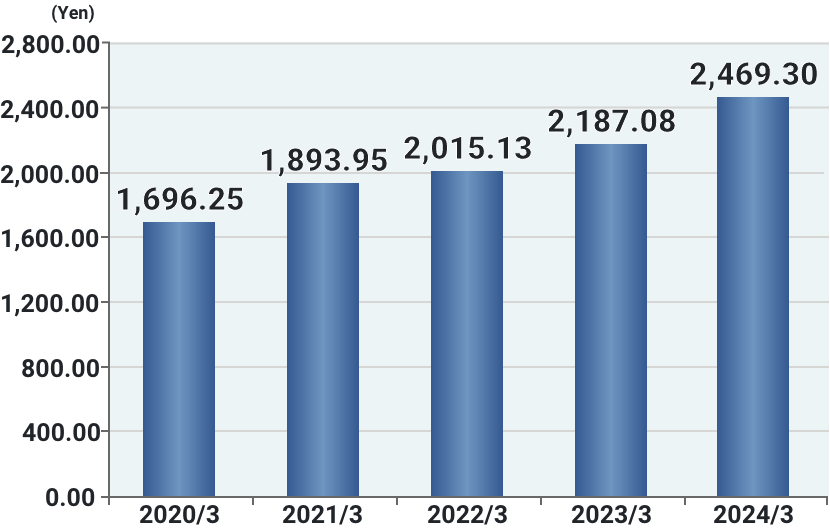
Book Value per Share [BPS]
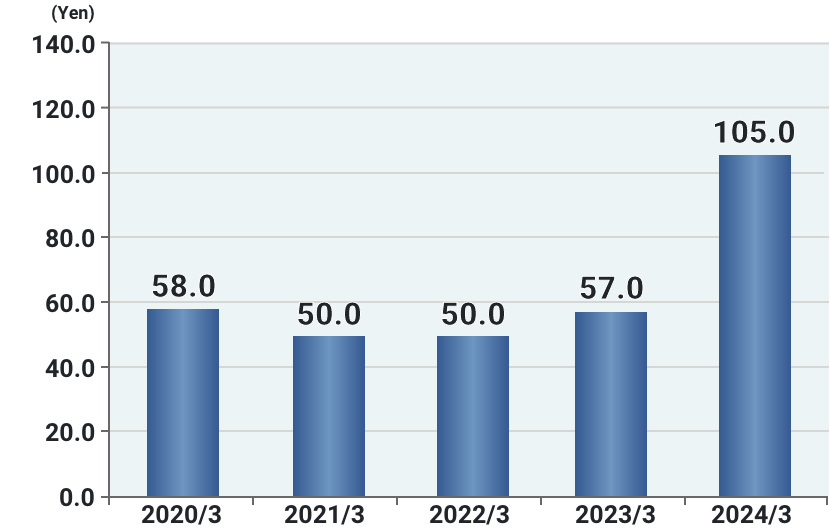
Dividend per Share
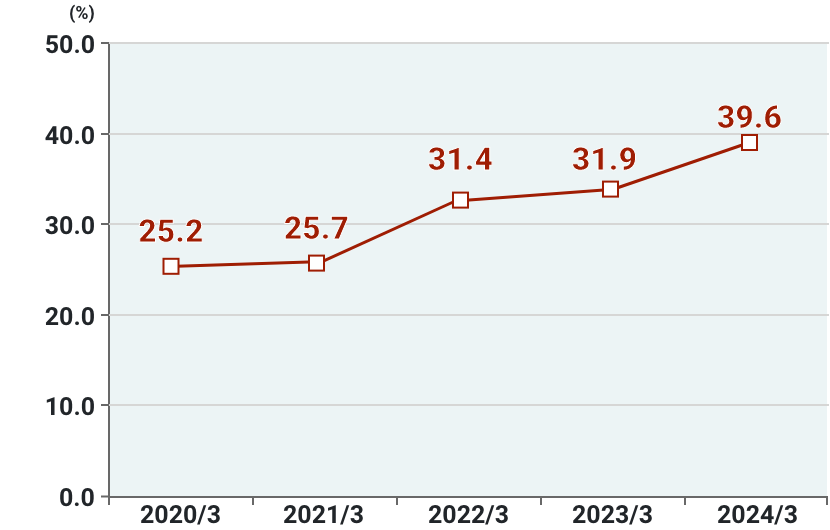
Dividend Payout Ratio
| 2020/3 | 2021/3 | 2022/3 | 2023/3 | 2024/3 | |
|---|---|---|---|---|---|
| Return on Equity [ROE](%) | 14.3 | 10.8 | 8.1 | 8.5 | 11.3 |
| Capital Adequacy Ratio(%) | 67.9 | 70.9 | 71.6 | 71.1 | 69.4 |
| Earnings per Share [EPS](¥) | 230.06 | 194.25 | 159.12 | 178.62 | 265.11 |
| Book Value per Share [BPS](¥) | 1,696.25 | 1,893.95 | 2,015.13 | 2,187.08 | 2,469.30 |
| Dividend per Share(¥) | 58.0 | 50.0 | 50.0 | 57.0 | 105.0 |
| Dividend Payout Ratio(%) | 25.2 | 25.7 | 31.4 | 31.9 | 39.6 |
* There will be a time lag from the date of information disclosure to the date of updating the pertinent page.
For the latest qualitative/quantitative information, please refer to the financial results and the like in the IR Information section.